
Where does traffic come from?
It has been observed that cities that have extremely good public transport still suffer from congestion and high numbers of cars. Whilst it is well-recognised that internally well-connected urban areas (for instance central London or central Manchester) have lower levels of car ownership and commensurately lower levels of car use for travel to work and other trips, congestion is still a major issue in these urban cores.
Mancunian Way (c) Creative Commons, by David Dixon/geograph.org
This paper looks at the impact of car trips originating in surrounding periurban and rural areas on inflating traffic levels, increasing congestion, contributing to CO2 emissions and degrading the urban environment. It examines area characteristics and how these affect car trips generated by commuting. These include factors such the population density, accessibility of public transport at journey origins, and the destinations - primarily work places - that are the reasons people travel.
In addition, interviews illustrate the experiences of people who drive in Greater Manchester, the reasons for their choices and the alternatives they would prefer.
The context is increasing vehicle miles traveled within the Greater Manchester region. This traffic has implications for air quality, carbon emissions and also congestion. Congestion does not merely impact car users – it slows public services including the emergency services and buses, worsening outcomes for public transport users and making service provision more difficult and costly.

In this study, I look at the impact of travel patterns on the central borough of Manchester, City of Manchester, within the Greater Manchester authority zone, compare it with other boroughs in Greater Manchester and look at some lived experiences which may explain the high car use and volumes of traffic in the area.
Data and experience
Using census data it is possible to get some insight into the types of car trips being made in each area and also the impact on surrounding areas. When the 2011 census was taken, Manchester was the third fastest growing city in the UK and by 2021 had increased substantially. The travel data from the 2011 census reflects the lower numbers at the time - however, over the last decade traffic and congestion has increased, suggesting that the trend has been for increased car use. The 2021 census data is awaited with great interest (albeit some concern that the impacts of lockdown may mean that the travel data could be anomalous).
Mapping trips to the availability of public transport gives some basic information about potential alternatives to car travel, but looking at real world examples demonstrates the information use to make travel mode choices.
People’s experiences, their family lives, work patterns and responsibilities are the final piece in this picture. Interviews are used to sense check and illustrate the journey patterns and to consider alternatives to car use.
Area and population
Greater Manchester is an area of around 1,276 square km / 493 square miles, with an east-west axis of 53km / 33.1 miles at its widest and north south axis of 39km / 24.4 miles at most. The total population of Greater Manchester is in the region of 2.7 million (worldpopulationreview.com Manchester Population 2021) and its average population density is 2,155 people per square kilometre.
However, the population of Manchester is unevenly distributed.
The most urban area, the City of Manchester, is a segment which extends from the centre to the southern perimeter. The furthest distance from this central zone within Greater Manchester is the western edge of Wigan - 40km / 25 miles away, and the north eastern edge of Rochdale about 36km / 23 miles away. This core zone is the most populous and densely populated area, home to around half a million people living at a population density of 4,716 people per square kilometre (worldpopulationreview.com). However, the eastern boroughs barely making the World Bank criteria for an urban area (1,500 people per square km). Within Greater Manchester, over 300,000 people live in areas with fewer than 1,500 people per square km in an area of 67,432 hectares, an area which represents 53% of the total surface area of the Greater Manchester Authority area.
Why does unevenness matter?
All journeys have an origin and a destination. The most easily identified origin destination pairs are home to work travel. For this study we’re looking at homes as the origin of trips. Uneven distribution of homes means an uneven distribution of trip origins; they will cluster in some (densely populated) areas and be more widely spread in others.
Where people live in less dense areas, their trips will tend to be longer (because destinations are less likely to be close by). This phenomenon is readily identified in rural travel patterns but less recognised as a feature in urban trips. However, the very unevenness of population in Greater Manchester means that substantial numbers of people will be making longer trips - and that these will contribute to the volume of vehicle movements in the area. For people’s lived experiences, mean data means very little. Whilst measurements like average journeys between centroids may appear short, an extra mile has a real impact on a person walking to work carrying a laptop, crossing a busy junction can really endanger the life of a cyclist and bus timetables that don’t match shift patterns can add unwelcome hours to the working day.
Greater Manchester at Work
Given the uneven nature of population (home/origin) distribution, we also need to look at destinations - in this case work. Where people work in the Greater Manchester area is also quite unevenly distributed. There is an (unsurprising) influx into central Manchester.
The impact on traffic in central Manchester will depend on how many of those people travel into the area by car.
At the same time, the borough of Manchester has the best accessibility score over the greatest area of any borough of Greater Manchester. This score takes a number of factors to calculate its relative accessibility by public transport.
This leads me to question why so many cars drive into central Manchester every day. Whilst the 2011 census data is now old (and only relates to commutes rather than the totality of trips made), it still indicates trends (pre-pandemic), which have only been exacerbated over the last decade as vehicle volumes have increased. It can be used to look at indicative flows of commuters (and, in particular, those driving into boroughs) to work out where they are coming from and why they chose to drive over public transport.
Within Greater Manchester, the City of Manchester has the largest areas and populations falling in the highest two GMAL levels indicating good public transport connectivity. It has the lowest percentage of residents driving to work (46%) and the lowest percentage of its workplace population arriving by car (49%) in the Greater Manchester area. However, over 157,000 people arrived in central Manchester by car daily (at the time of the census).
The 2011 census found 181,282 people living in the Manchester borough who were aged 16 and over and were in employment the week before the census. Of these people 108,658 work in the borough. Of these people - who live and work within the borough - 38,872 drive to work in a car or van (35.77%).
This implies that the remaining 118,696 people driving into Manchester are coming from outside the borough - a huge number of cars and vans arriving in the city core daily.
The origins of public transport commuting into central Manchester correspond to the better areas of access on the Greater Manchester Accessibility Level scale.
Unsurprisingly, all the outer boroughs - with lower GMAL scores - have higher levels of residents driving to work and also people arriving by car into each borough. For each borough, we can calculate how many people drive to work within the borough but also how many people drive from one borough to the next (or even further afield).
For instance, Bolton, with a resident population of 104,615 people has a workplace population of 114,946. Of the working population that live in the area, 60% also work in the area - with 67% of them driving to work within the area. Nearly 4,000 people drive from Bolton to Central Manchester, adding to congestion there (and en route).
Other boroughs have a lower proportion of residents working within the borough and contribute greater levels of traffic to other areas (including the city zone).
Looking at how the surrounding boroughs contribute car traffic to the central urban area of Manchester, the top ‘traffic contributors’ in terms of numbers of vehicles are:
Stockport 16,635
Trafford 15,360
Tameside 10,231
Salford 8,582
Oldham 7,447
Bury 7,404
Rochdale 5,850
Bolton 3,918
The total number of cars from other Greater Manchester boroughs is 78,949 - contributing 56.7% of the cars arriving in central Manchester.
An additional 21,486 cars/vans arrive in central Manchester from outside Greater Manchester (15.4%). Significant contributions of car traffic are made by Cheshire and Warrington.
The bottom line is that 72.1% of cars arriving in the city of Manchester have come from outside the borough, from areas with less public transport connectivity both within the Greater Manchester area and beyond.
(source: NOMIS 2011 Census WU03UK - Location of usual residence and place of work by method of travel to work).
Central Manchester is the least car dependent area of the authority; the best case in Manchester.
With the most extensive public transport network of the 10 boroughs, 35% of people living and working within Manchester City drive to work. A higher proportion of those travelling from less well connected areas drive in.
Outside this zone, all other boroughs have higher levels of car use both within and travelling across borough boundaries.
Bolton
The borough of Bolton is the north west of Greater Manchester, with a population of 285,400 (bolton.gov.uk people in Bolton Factfile no.1 2018 population estimates) in borough covering 139.8 square km. This works out as a population density of 2,041.5 people per square km (this is slightly higher than the 2011 census data of 276,786 usual residents and population density of 1,980 people per square km used for mapping purposes in this paper).
This variation means that 14% of the borough’s population live in areas that are less densely inhabited than ‘urban’ areas. The combined area of these areas is 56% of the surface area of the borough. 84% of the borough population live in 44% of its surface area. Looking at the area, it’s clear that the distances those people living in less dense LSOAs will travel are likely to be greater than those in more
Bolton at work
94,669 people were recorded as working in Bolton in the 2011 census, of these 62,464 also live within the borough. Almost 90% (85,018) people working in Bolton are from within the Greater Manchester area. Despite this relative proximity 60.27% people living and working within Bolton drive to work, and 65.44% of those who work in Bolton and live within Greater Manchester drive to work (Nomisweb.co.uk WU03UK - Location of usual residence and place of work by method of travel to work). Of those who do not drive to work, the second largest group is those who walk to work - 10,629 people or 12.5% of those working in the borough. Unsurprisingly, this group walk to work almost exclusively from within the borough.
Travel from the rest of the North West into Bolton is more limited - with just under 10,000 people travelling from boroughs outwith Greater Manchester but within the North West. A total of 8,292 drive into the borough - 85% of those arriving for work from these outlying areas and about 13% of the total commuting traffic.
Bolton has an area around the town of Bolton which qualifies for the highest levels of the Greater Manchester Accessibility Levels, but the rest of the borough is less well connected by public transport (see map above).
The population density of Bolton qualifies it as ‘urban’ by World Bank criteria: over 1,500 people per square km in contiguous grid cells. However this mean density hides the variation of population over the area of the borough.
Living in Bolton - Lived Experience
For this study I interviewed people living in Bolton about their experiences of travelling to work and why they made the choices they had about their modes of travel. These were free flowing interviews which were noted at the time. Emotions related to travel and transport were recorded.

The first interviews were conducted with a couple living in Horwich. Horwich is a town within Bolton on the edge of the urban area adjacent to Winter Hill and Rivington pike moorland with a recorded area of 14.2 square kilometres and a population 20,067 (2011 census) and a calculated population density of about 1,418 people per square kilometre. The journey origin is marked in pink on the population map of Bolton.
Journey to work 1
I hate my commute so much I would rather work from home. I quite enjoy being in the office but I hate the commute. I’m forced to [travel] really early to be able to park. I started to go to work earlier and earlier for it to be reliable and not too unpleasant and be able to park.
About the journey
Postcode BL6 7DQ to Spinningfields central Manchester (M3 3EB).
5.45am: Drive to train station Horwich Parkway (3 miles)
6.10 am: Train to Manchester Piccadilly or Victoria
6.40 am: change at Salford Crescent for Salford Central
6.45am: Walk to Spinningfields
6.50am: arrive at work
The return trip starts at 3pm and is the reverse.
Total journey time: 1hr 5 minutes.
Total travel distance: 19 miles (3 miles by car, about 15 miles by train and 0.7 miles on foot)
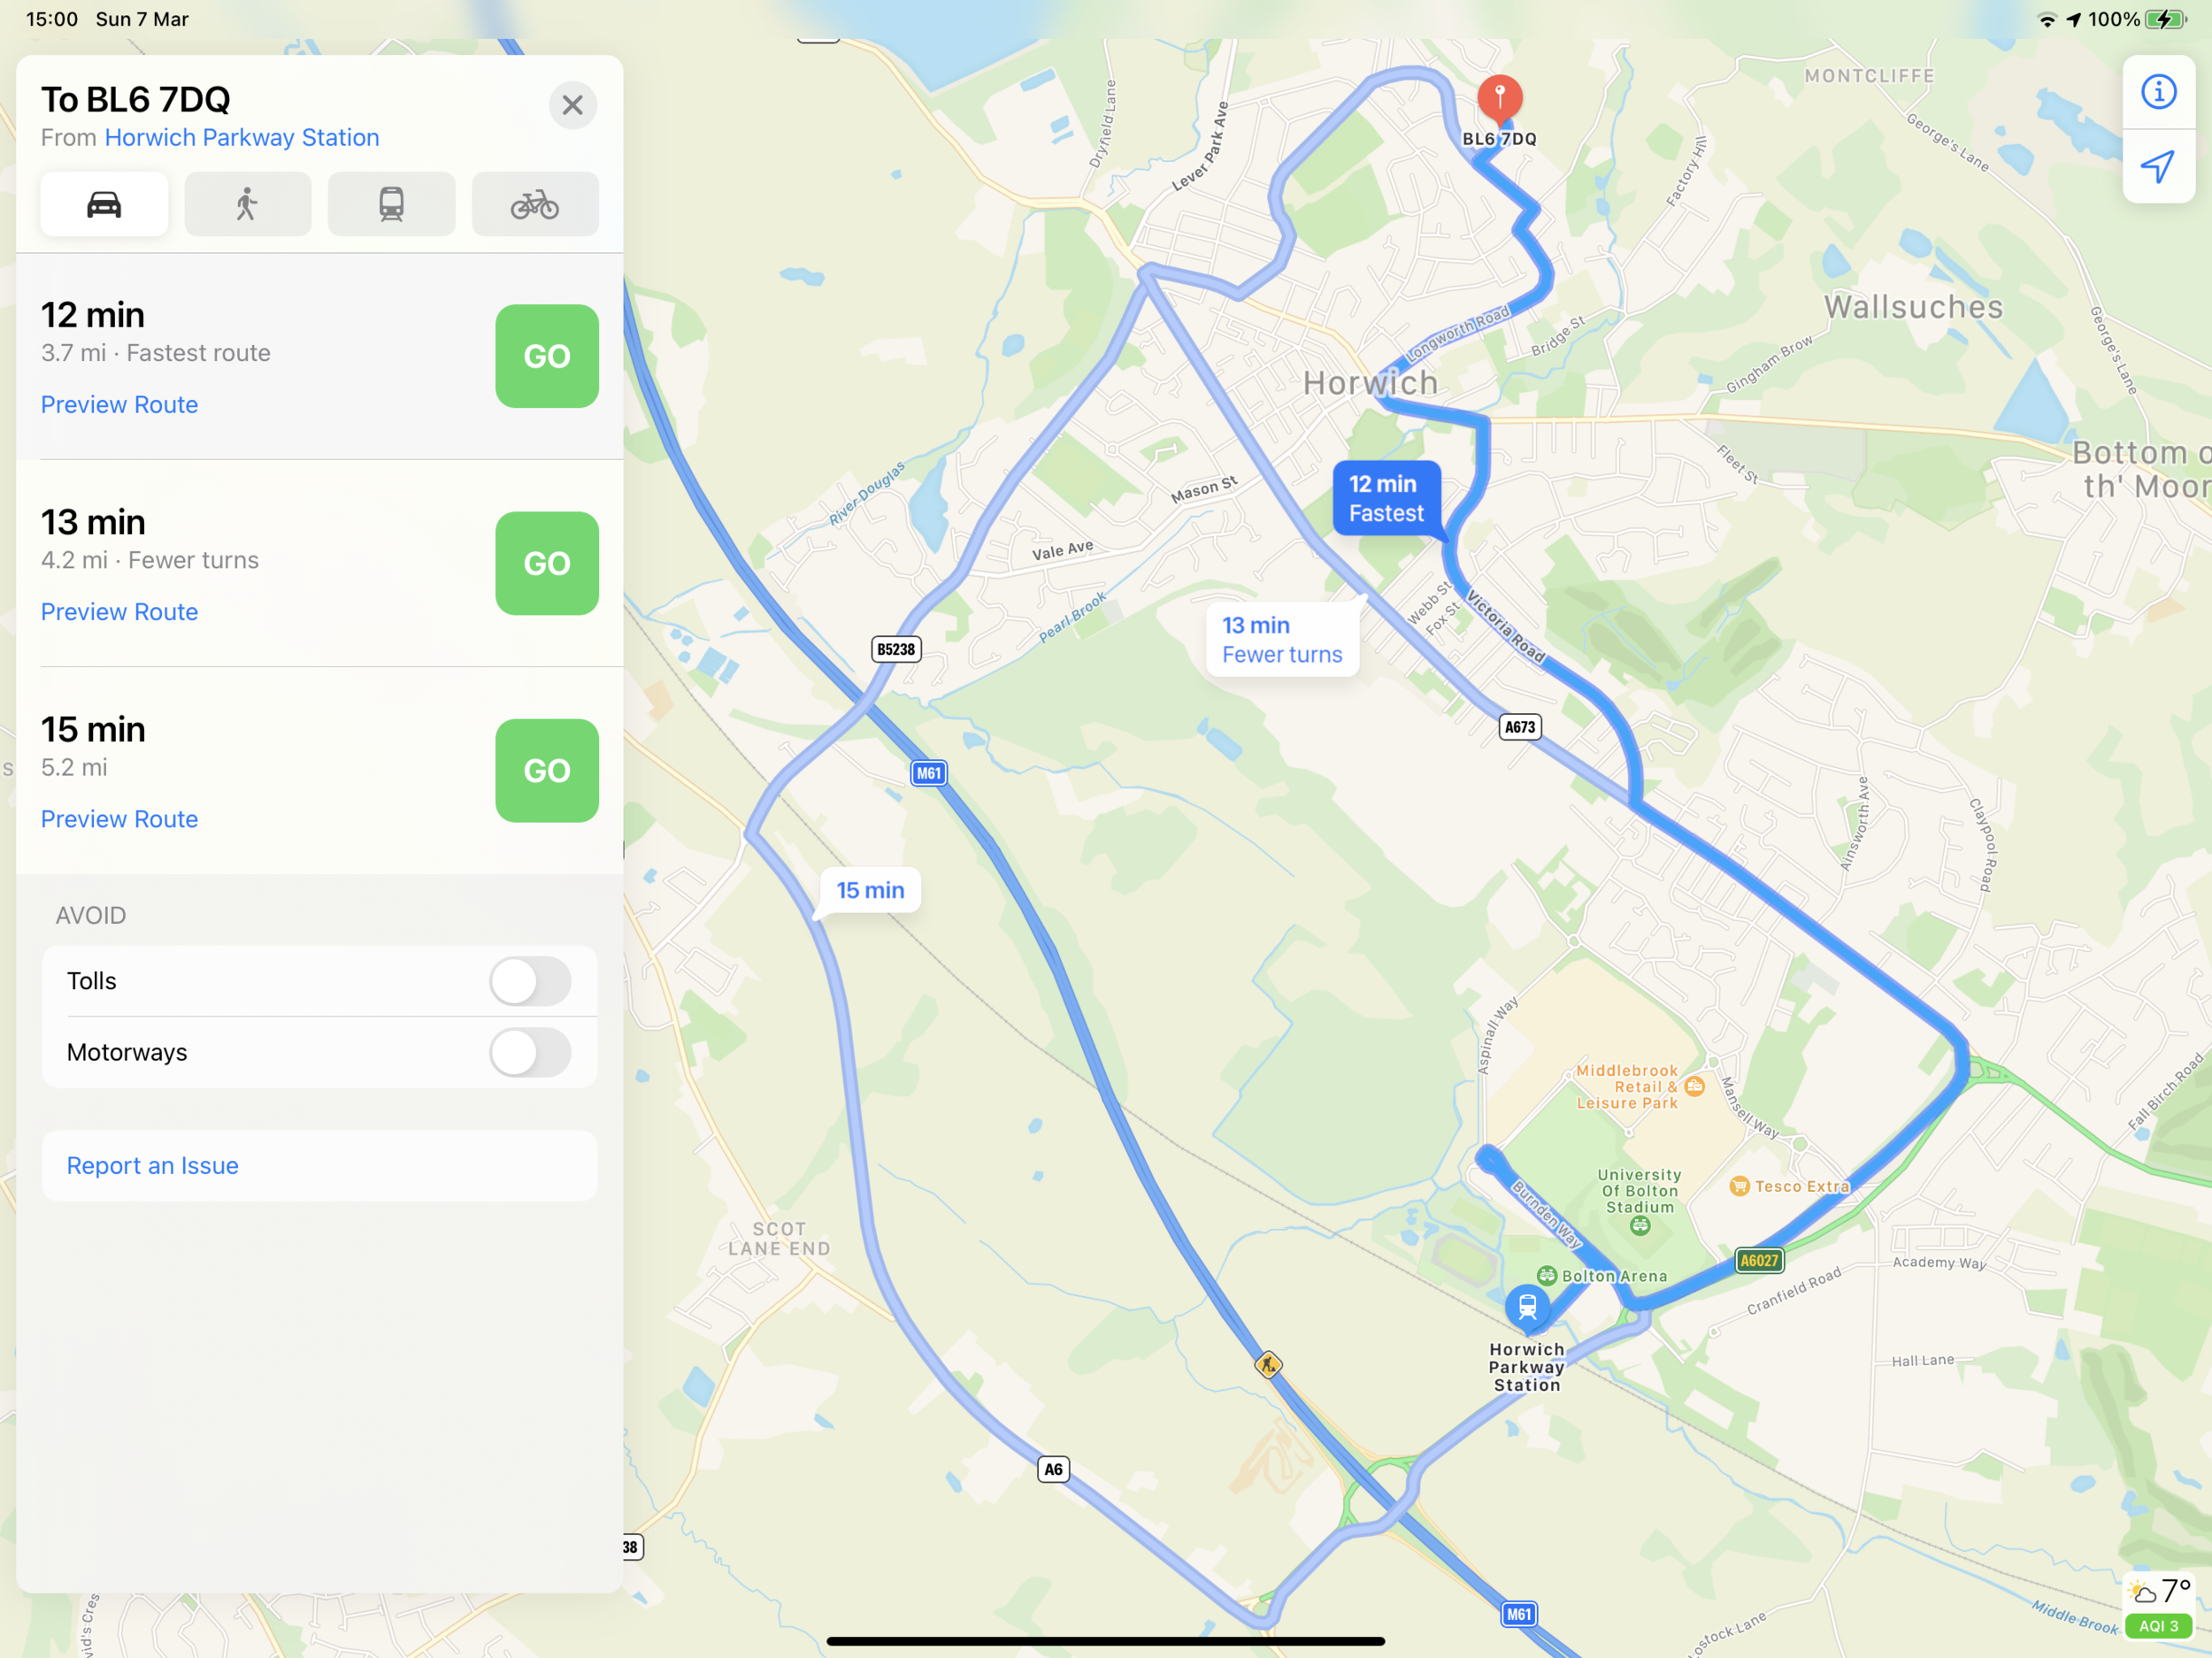
Travel by car to Horwich Parkway
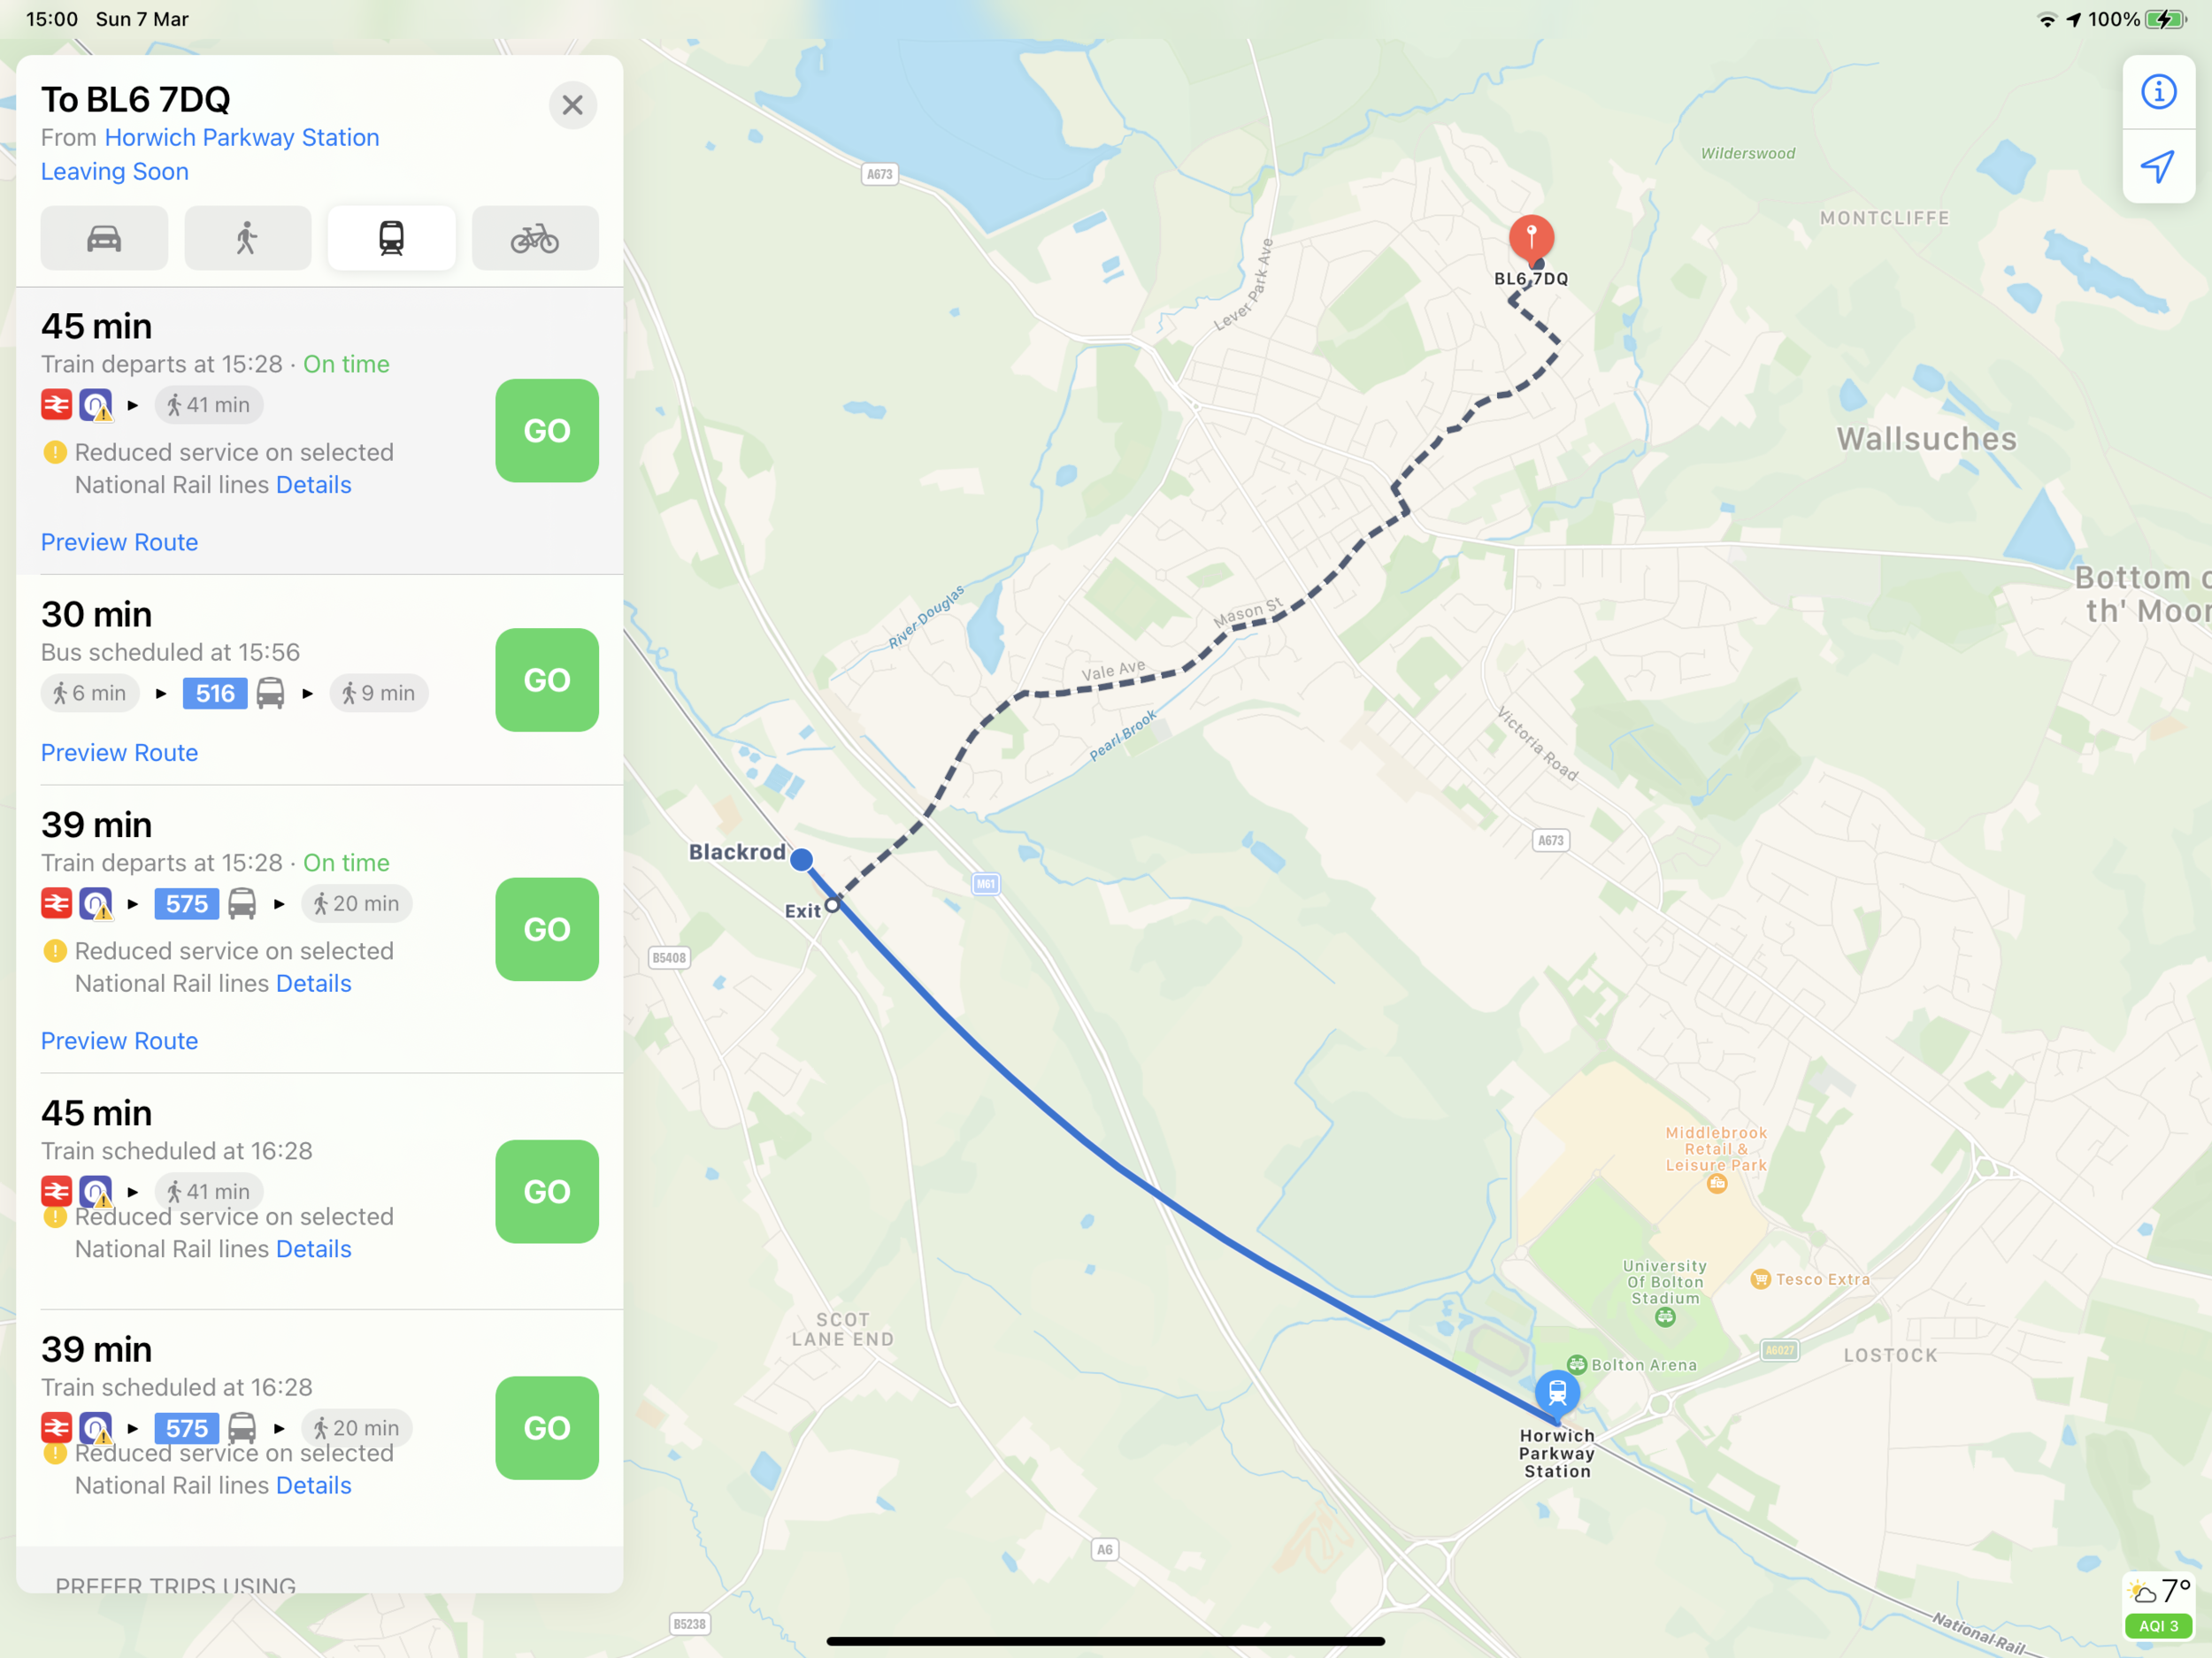
Travel by public transport to Horwich Parkway
The bus only goes to Bolton, not the train station
There’s a closer station at Blackrod but only one train an hour.
I go so early because Horwich Parkway station is so busy that you can’t park there any later than 7am. It’s on the boundary for TfGM so ticket prices are lower than the next well-serviced stop (Chorley) so people drive from Chorley, Preston and further afield to use the train. Also the neighbouring stations charge to park.
It’s easy also to see why the interviewee drives rather than uses public transport to the station - there is a huge time penalty for using a bus/train combination, plus the interviewee’s concerns about reliability would be increased. I asked what other alternatives there are for reaching the station.
I could ride or run to the station. It’s downhill on the way there but uphill on the way home. I have to carry a laptop. If there was an off-road cycle route I’d like that - it would be preferable. I don’t do road riding.
Driving into Manchester was not considered, however:
Wouldn’t consider driving into Manchester. Apart from the day after the Arena bombing because the station was shut. It was awful.
Notes:
This journey would count as a journey on public transport despite the drive at the outset and road and parking required to enable it (this is unlikely to be an isolated example, rail station car parks are full and these trips to the station are likely to be concealed in the census data around driving).
It’s clear that there is little flexibility in options for this trip for reducing car journeys - the time penalty for using public transport is too great and there is no cycle infrastructure to connect the origin address to the station. In addition, the worries about reliability drive the choices made and are the prime reason for any change to the normal plan.
In addition the general public transport connectivity of the area is poor and the houses sufficiently recent to all have drives and often garages (in line with post war planning guidance). Despite this roads are also narrowed by a great deal of on road parking as per household car numbers exceed off-road parking space.
Journey to work 2
I’ve always had a big commute. I didn’t mind driving. When I look for a job I look at whether it’s commutable by car. I did work in Bolton for 8 months for a short commute.
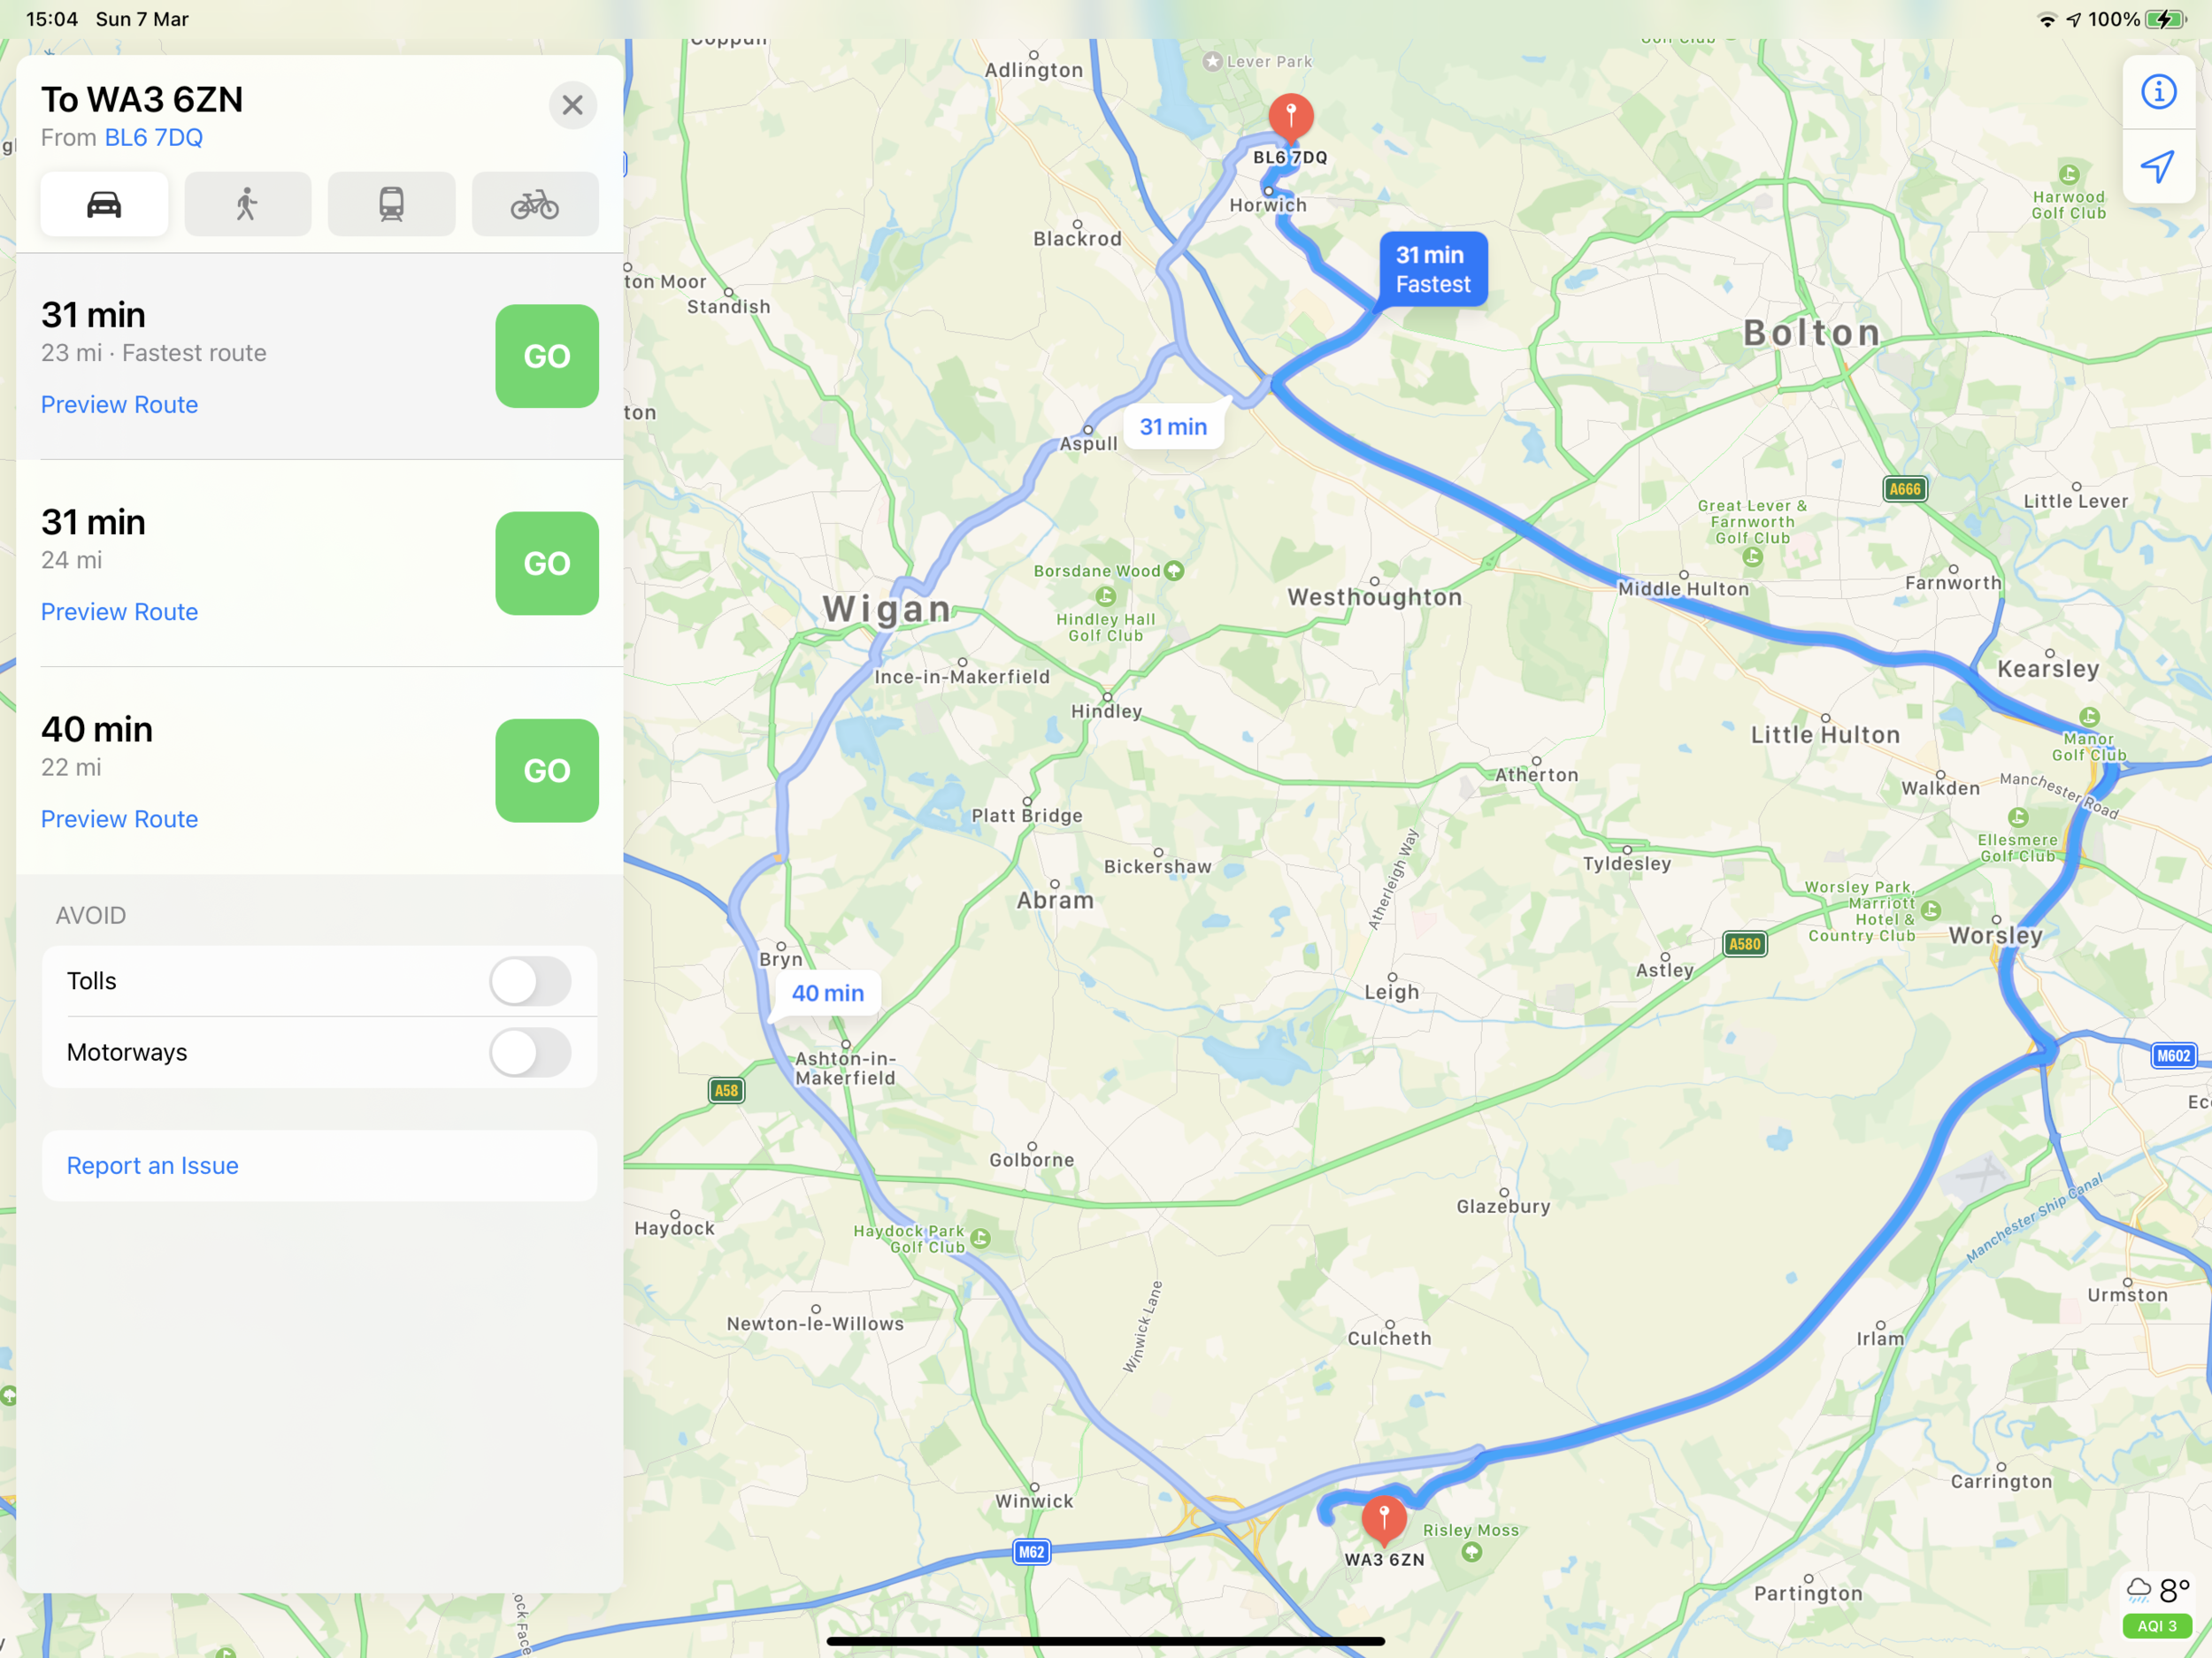
About the journey
18 - 40 miles depending on traffic
It takes 55 minutes in the morning, upto an hour and a half to get home.
Travel planning for this route does not reflect commuter experience
If I didn’t leave by 6.45am it would take an additional half hour. The later, the longer. There are more problems getting home - the longest it’s taken is 3 hours. You can see the motorway from the junction, I’ll get to the M62 and check it’s moving - if not turn round and go through the back lanes to M6 to Chorley then cross country from Chorley. I might do 40 miles. I check the traffic report a lot.
Asked about alternatives:
I sometimes ride a bike or do ride/drive combination. The ride is really direct, 16 miles, and I can do it in 45 minutes on the way but it’s climbing on the way home so not as fast.
From here, drop down to the motorway junction, jump on a wide B road with a bit of cycleway. Then have to cross the A580 at Greyhound Island. There’s no pedestrian crossing at the roundabout - a 3 lane roundabout with industrial estates and artic lorries. Once I’ve crossed the 4 land dual carriageway I am very relieved. Then it’s A road past Risley - but that’s the main commute into Warrington. In the morning it’s ok as it’s still quiet but coming home people are parked on the road so you have to filter on the off side. That is really unpleasant for 6 miles.
There’s no public transport alternative without going into Manchester and out again. Allegedly there’s a bus that takes 1 hour 32 minutes or 2 trains which are ‘Russian roulette’.
What is the ideal commute?
8-10 miles on a cycle path. If I had to commute it would be best by bike. I am preferring to work from home for not commuting. Doing bike commuting was good for cycling mileage and fitness.
Notes
Although a driving commute was initially ‘the plan’ the interviewee likes cycling. However cycle infrastructure is lacking and there is palpable danger associated with parts of the commute when cycled.
This commute does not impinge on central Manchester but it passes through at least one other borough en route to the destination.
Both people in the household require a car to enable them to commute - and not having a car is unthinkable in this area.
Lived experience v GMAL accessibility
It’s notable that the area in which these people live is ‘built up’ with a population density of 3,520 people per square km. Its GMAL score is 4 (on the scale of 1 - 8 with 8 being most accessible). Looking at the population density, however, there is a small group of LSOAs with population density of over 3,000 people per square kilometre. However, this is at some distance from the densest areas of Bolton with more sparsely populated areas in between (and, somewhat obviously, also from workplaces in central Manchester).
A GMAL of 4 is not adequate to provide a useful public transport network for the people living in the area. Comparing car travel times for other potential journeys - for instance from Horwich to Bolton Hospital NHS Foundation Trust (employer of over 5,000 people in an area with a GMAL score of 5) shows a huge difference between public transport and car travel times:
By car: 8.5 - 10 miles, journey time 20-24 minutes (does not include time spent parking)
By public transport: 1 hour 1 minute - 1 hour 35 minutes (including 11 minutes walking and 2 buses)
The time penalties for using public transport are at least an hour a day and could be over 2 hours per round trip. This makes the choice of driving seem obvious (the cost of £5 per day for a day bus ticket is comparable with driving costs although these will vary depending on vehicle and are notoriously underestimated by drivers).
Impacts
Besides the impact on congestion and air quality, there is a carbon cost associated with driving. The carbon.place calculator estimates that this LSOA generates above England average carbon emissions from driving (C- is just slightly below average - D+ and E+ are increasingly above average). In absolute terms, driving generates 18% of each person’s carbon footprint in this area - over a tonne of CO2 emissions, per person, per year.
In many ways the driving impetus reinforces the need to drive. High levels of on-street parking reduce the attractiveness and amenity value of roads for pedestrians and cyclists.

Around the Boroughs
The story across the boroughs is the same. Whilst a sizeable proportion of people are travelling by car within the borough, a big chunk of people drive to work from within the Greater Manchester area (largely from those areas with lower GMAL scores) and a constant number in excess of 10% drive from outlying areas of the North West. Each sector contributing to traffic flows within the areas.